History List
show difference
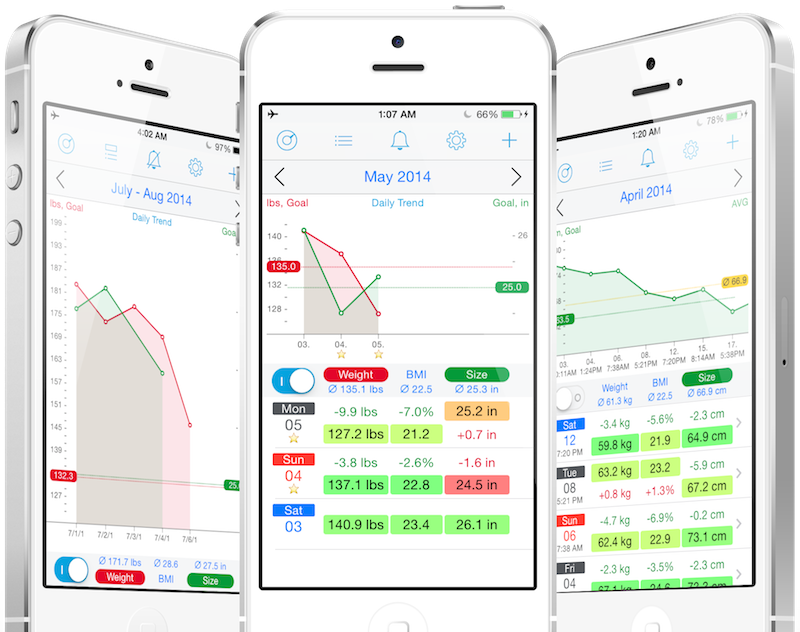
History view is switchable between daily trend list in 2 monthes period and all records list in a month period.
Difference of measurement values are shown in value and percent.
Background color of each measurement value and 3 height positions in the row show the changing status of measurement values: higher, equal or lower than the previous value.
History view is changeable between the list only, the list with diagram and the full screen diagram (swipe down on the graph).